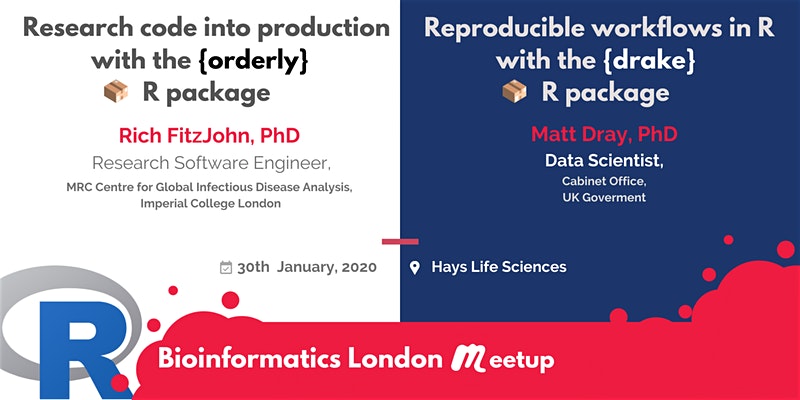
REPRODUCIBILITY 4 LYFE (via Bioinformatics London’s Meetup page)
tl;dr
I spoke at the latest Bioinformatics London Meetup (event link, Twitter) about workflow reproducibility tools in R. I explained the benefits of Will Landau’s {drake} package for doing this.
Order, order
Rich FitzJohn opened proceedings with an excellent introduction to his {orderly} package (source) that is intended for ‘lightweight reproducible reporting’.
In short, the user declares inputs (anything, including things like SQL queries and CSV files) and artefacts (results) of their analysis. {orderly} loads what is declared, evaluates and runs what is necessary, and verifies that the declared artefacts are made. A bunch of metadata is stored alongside the analysis that can be used later to determine the source of any dependency changes.
I followed up with the basics of {drake}. My slides are in the following section.
We were also lucky to have a celebrity guest on the line: the creator of {drake}, Will Landau, who said some words about the package’s development and took questions. Will was also able to extend gratitude to Rich for having developed {remake}, a workflow manager for R that was a precursor to the development of {drake}.
Slides
You can open the slides in a dedicated tab (press P for presenter notes) or see the source. The slides introduce the idea of a workflow manager to improve reproducibility and how {drake} can fill that gap.
The second half of the presentation contains a small and simple demonstration of {drake} in action using R’s excellent built-in beaver-temperature datasets.
Bonus reproducibility: the {drake} analysis takes place in the slides themselves and is recreated from scratch when they’re regenerated. This is made possible by {xaringan}, Yihui Xie’s package for reproducible presentations.
I also created a single file containing the code that was run in the slides.
Click for the {drake} code.
# Reproducible workflows with {drake}
# Bioinformatics London Meetup, 2020-01-30
# This is a script file containing the code from the talk slides
# Source: github.com/matt-dray/drakebioinformatics
# Slides available here: matt-dray.github.io/drake-bioinformatics/

# Packages ----------------------------------------------------------------

# All available from CRAN with install.packages()
library(drake)
library(dplyr)
library(ggplot2)
library(rphylopic)  # get CC0 organism graphics

# Functions ---------------------------------------------------------------

# Simple beaver plot
b_plot <- function(data, image) {
  ggplot(data, aes(id, temp)) +
    geom_boxplot() +
    labs(title = "Beaver temperature") +
    add_phylopic(image)
}

# Simple beaver summary table
b_table <- function(data) {
  beavers_trim <- data %>%
    group_by(id) %>%
    summarise(
      mean = mean(temp), sd = sd(temp),
      min = min(temp, max = max(temp))
      ) %>% ungroup()
  return(beavers_trim)
}

# Plan --------------------------------------------------------------------

# Wrap analysis steps in drake_plan()

plan <- drake_plan(

  # 1. Wrangle data

  b1 = mutate(beaver1, id = "A"),  # built-in dataset
  b2 = mutate(beaver2, id = "B"),  # built-in dataset
  beavers = bind_rows(b1, b2),

  # 1. Get phylopic image

  uid = "be8670c2-a5bd-4b44-88e8-92f8b0c7f4c6",
  png = image_data(uid, size = "512")[[1]],

  # 3. Generate outputs
  # The .Rmd is avaiable from github.com/matt-dray/drake-bioinformatics

  plot = b_plot(beavers, png),
  table = b_table(beavers),
  report = rmarkdown::render(
    knitr_in("beavers-report.Rmd"),  # note knitr_in()
    output_file = file_out("beaver-report.html"),  # note file_out()
    quiet = TRUE
  )

)

# Make --------------------------------------------------------------------

drake::make(plan)  # executes the analysis steps in the plan

# Inspection --------------------------------------------------------------

# Get cached objects
cached()  # check what's in the cache
readd()  # return an object from the cache

# Create network graph
config <- drake_config(plan)  # make a configuration file for the plan
vis_drake_graph(config)  # build an interactive network graph using the config

# Make changes ------------------------------------------------------------

# Let's say something in your workflow changed. What is now out of date?

outdated()  # prints the targets that are out of date

vis_drake_graph(config)  # rebuild grpah to see impacted targets coloured black

drake::make(plan)  # re-make the plan!