A bee scene from irreverent 90s Nicktoon ‘Hey Arnold!’ (via Giphy)
How to plot grouped continuous data?
A boxplot lets you show continuous data split by categories, but it hides the data points and doesn’t tell you much about distribution. A violin chart will show the distribution but you still don’t know about the density of data.
Stripcharts show the data for each category as individual points. The points can be layered on top of each other where they take the same Y value and can be stretched arbitrarily along the X axis.
If you don’t have too much data, or if you sample it, you can stop the data points in a stripchart from overlapping and instead line them up side by side where they take the same Y value. This is called a ‘beeswarm’. Why? Probably because the cloud of data you’re plotting looks a bit like a swarm of bees.
Below is how the plots look side by side.
Click for code
library(ggplot2)  # for plotting
library(ggbeeswarm)  # more on this later
suppressPackageStartupMessages(library(cowplot))  # arrange plots

# Create data set
data <- data.frame(
  "variable" = rep(c("runif", "rnorm"), each = 100),
  "value" = c(runif(100, min = -3, max = 3), rnorm(100))
)

# Generate different plot types
canvas <- ggplot(data, aes(variable, value))
box <- canvas + geom_boxplot() + ggtitle("Boxplot")
violin <- canvas + geom_violin() + ggtitle("Violin")
strip <- canvas + geom_jitter(width = 0.2)  + ggtitle("Stripchart")
bee <- canvas + geom_quasirandom()  + ggtitle("Beeswarm")  # more on this later

# Arrange plots
grid <- plot_grid(box, violin, strip, bee)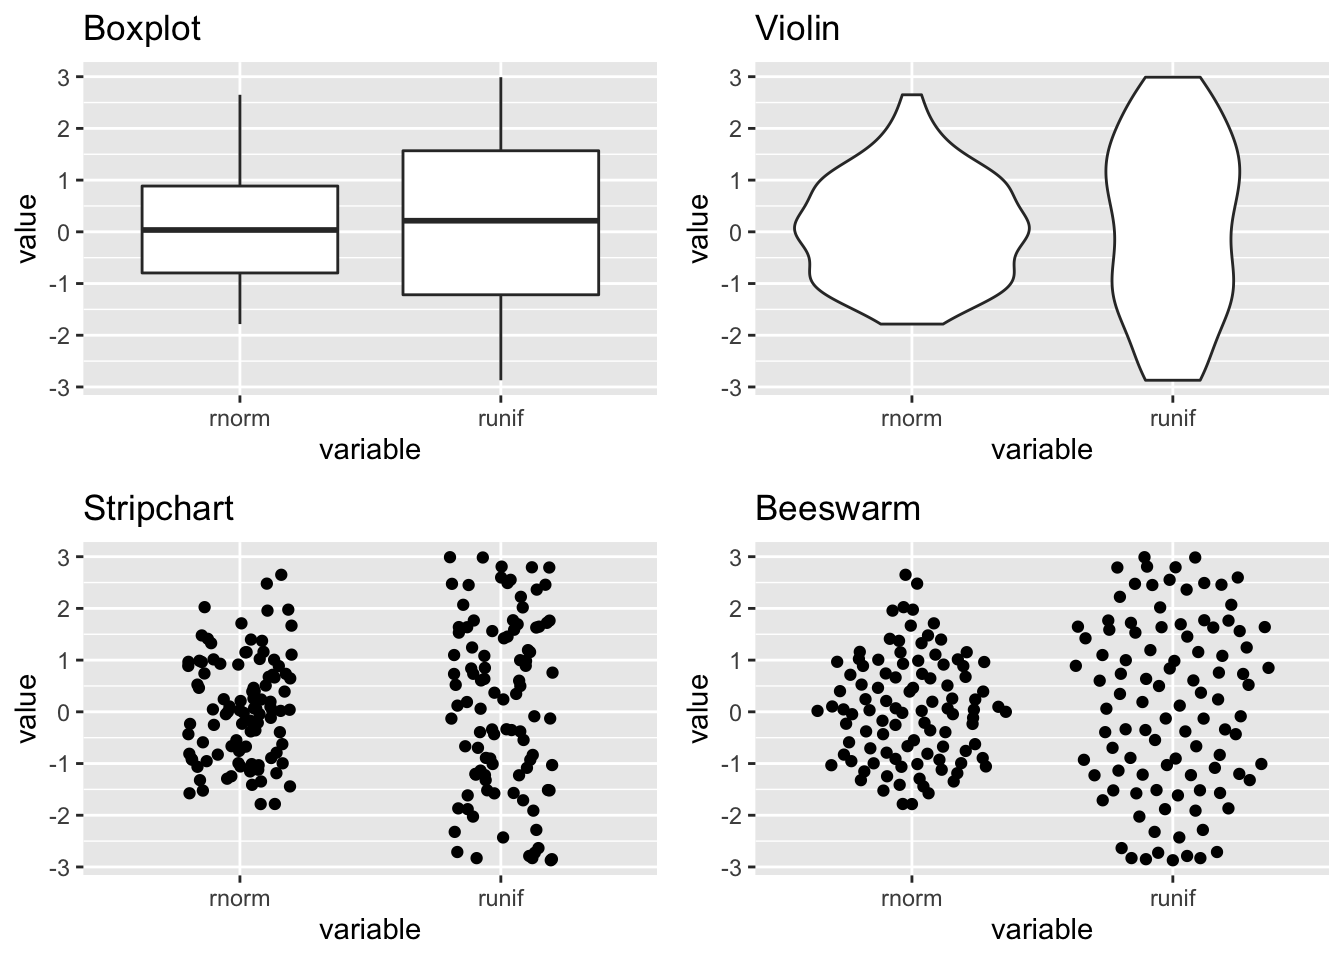
Obvious next step
We can test this theory by plotting the points as actual bees, lol. Well, emoji bees. Duncan (of {tidyxl} and {unpivotr} fame) did exactly this and tweeted the plot and code.
Code pic.twitter.com/Wkss1c51B7
— Duncan Garmonsway (@nacnudus) November 15, 2018
To summarise, Duncan did this by hacking emojis via {emoGG} into {ggbeeswarm}’s geom_beeswarm() function to create gg_beeswarm_emoji() – patent pending, presumably.
Obvious next next step
Wouldn’t it be better if the little emoji bees moved around a little bit? Almost like a waggle dance?
I cheated a little bit and recoded the geom_quasirandom() function from {ggbeeswarm} instead of geom_beeswarm(). Why? Beeswarm plots have an inherent ‘neatness’ to them. That is not becoming of a beeswarm. Instead, geom_quasirandom() gives you some ‘random’ jitter each time you plot the data.
So we can plot the same data several times and stack the images into a gif. One easy way to do this is via the {magick} package, a re-engineering of the open-source ImageMagick sute of tools from Jeroen Ooms at ROpenSci.
Code
Load the packages.
library(ggplot2)
library(ggbeeswarm)  # on CRAN
library(emoGG)  # remotes::install_github("dill/emoGG")
library(magick)
Recode the geom_quasirandom() to display emoji. Idea stolen from Duncan’s tweet.
geom_quasi_emoji <- function (
  mapping = NULL, data = NULL, width = NULL, varwidth = FALSE,
  bandwidth = 0.5, nbins = NULL, method = "quasirandom", groupOnX = NULL,
  dodge.width = 0, stat = "identity", position = "quasirandom",
  na.rm = FALSE, show.legend = NA, inherit.aes = TRUE, emoji = "1f4l1d", ...
) {

  img <- emoji_get(emoji)[[1]]

  position <- position_quasirandom(
    width = width, varwidth = varwidth,
    bandwidth = bandwidth, nbins = nbins, method = method,
    groupOnX = groupOnX, dodge.width = dodge.width
  )

  ggplot2::layer(
    data = data, mapping = mapping, stat = stat,
    geom = emoGG:::GeomEmoji, position = position, show.legend = show.legend,
    inherit.aes = inherit.aes, params = list(na.rm = na.rm, img = img, ...)
  )
}
It makes sense to use the data that Duncan generated so we can compare the static plot to the animated one.
swarm <- data.frame(
  "variable" = rep(c("runif", "rnorm"), each = 100),
  "value" = c(runif(100, min = -3, max = 3), rnorm(100))
)
Let’s define what our plot should look like. method = "pseudorandom" is the bit that gives us the jittering.
plot <- ggplot(swarm, aes(variable, value)) +
  geom_quasi_emoji(emoji = "1f41d", method = "pseudorandom") +
  theme(panel.background = element_rect(fill = "skyblue")) +
  ggtitle("WAGGLE DANCE")
Now we can create a few versions of this plot with different jittering. The plots are magick-class objects made with image_graph() from the {magick} package.
We can loop through a few plots, each representing a frame in the final gif.
And now image_animate() can be used to combine those magick objects into a gif.
waggle_dance <- image_animate(c(t1, t2, t3, t4))
waggle_dance
And we can save this with image_write().
image_write(waggle_dance, "waggle_dance.gif")Well done, we got through this without any bee puns.
Session info
## [1] "Last updated 2019-12-31"## ─ Session info ───────────────────────────────────────────────────────────────
## setting value
## version R version 3.6.1 (2019-07-05)
## os macOS Sierra 10.12.6
## system x86_64, darwin15.6.0
## ui X11
## language (EN)
## collate en_GB.UTF-8
## ctype en_GB.UTF-8
## tz Europe/London
## date 2019-12-31
##
## ─ Packages ───────────────────────────────────────────────────────────────────
## package * version date lib source
## assertthat 0.2.1 2019-03-21 [1] CRAN (R 3.6.0)
## beeswarm 0.2.3 2016-04-25 [1] CRAN (R 3.6.0)
## bitops 1.0-6 2013-08-17 [1] CRAN (R 3.6.0)
## blogdown 0.17 2019-11-13 [1] CRAN (R 3.6.0)
## bookdown 0.16 2019-11-22 [1] CRAN (R 3.6.0)
## cli 2.0.0 2019-12-09 [1] CRAN (R 3.6.1)
## colorspace 1.4-1 2019-03-18 [1] CRAN (R 3.6.0)
## cowplot * 1.0.0 2019-07-11 [1] CRAN (R 3.6.0)
## crayon 1.3.4 2017-09-16 [1] CRAN (R 3.6.0)
## digest 0.6.23 2019-11-23 [1] CRAN (R 3.6.0)
## dplyr 0.8.3 2019-07-04 [1] CRAN (R 3.6.0)
## emoGG * 0.0.2 2019-12-31 [1] Github (dill/emoGG@96a1018)
## evaluate 0.14 2019-05-28 [1] CRAN (R 3.6.0)
## fansi 0.4.0 2018-10-05 [1] CRAN (R 3.6.0)
## farver 2.0.1 2019-11-13 [1] CRAN (R 3.6.0)
## ggbeeswarm * 0.6.0 2017-08-07 [1] CRAN (R 3.6.0)
## ggplot2 * 3.2.1 2019-08-10 [1] CRAN (R 3.6.0)
## glue 1.3.1 2019-03-12 [1] CRAN (R 3.6.0)
## gtable 0.3.0 2019-03-25 [1] CRAN (R 3.6.0)
## htmltools 0.4.0 2019-10-04 [1] CRAN (R 3.6.0)
## knitr 1.26 2019-11-12 [1] CRAN (R 3.6.0)
## labeling 0.3 2014-08-23 [1] CRAN (R 3.6.0)
## lazyeval 0.2.2 2019-03-15 [1] CRAN (R 3.6.0)
## lifecycle 0.1.0 2019-08-01 [1] CRAN (R 3.6.0)
## magick * 2.2 2019-08-26 [1] CRAN (R 3.6.0)
## magrittr 1.5 2014-11-22 [1] CRAN (R 3.6.0)
## munsell 0.5.0 2018-06-12 [1] CRAN (R 3.6.0)
## pillar 1.4.3 2019-12-20 [1] CRAN (R 3.6.0)
## pkgconfig 2.0.3 2019-09-22 [1] CRAN (R 3.6.0)
## png 0.1-7 2013-12-03 [1] CRAN (R 3.6.0)
## proto 1.0.0 2016-10-29 [1] CRAN (R 3.6.0)
## purrr 0.3.3 2019-10-18 [1] CRAN (R 3.6.0)
## R6 2.4.1 2019-11-12 [1] CRAN (R 3.6.0)
## Rcpp 1.0.3 2019-11-08 [1] CRAN (R 3.6.0)
## RCurl 1.95-4.12 2019-03-04 [1] CRAN (R 3.6.0)
## rlang 0.4.2 2019-11-23 [1] CRAN (R 3.6.0)
## rmarkdown 1.18 2019-11-27 [1] CRAN (R 3.6.1)
## scales 1.1.0 2019-11-18 [1] CRAN (R 3.6.0)
## sessioninfo 1.1.1 2018-11-05 [1] CRAN (R 3.6.0)
## stringi 1.4.3 2019-03-12 [1] CRAN (R 3.6.0)
## stringr 1.4.0 2019-02-10 [1] CRAN (R 3.6.0)
## tibble 2.1.3 2019-06-06 [1] CRAN (R 3.6.0)
## tidyselect 0.2.5 2018-10-11 [1] CRAN (R 3.6.0)
## vipor 0.4.5 2017-03-22 [1] CRAN (R 3.6.0)
## withr 2.1.2 2018-03-15 [1] CRAN (R 3.6.0)
## xfun 0.11 2019-11-12 [1] CRAN (R 3.6.0)
## yaml 2.2.0 2018-07-25 [1] CRAN (R 3.6.0)
##
## [1] /Users/matt.dray/Library/R/3.6/library
## [2] /Library/Frameworks/R.framework/Versions/3.6/Resources/library